

How do you show a personal journey through data?
As the first assignment for the Master of Digital Design at Hogeschool van Amsterdam, we were given three days to create a poster visualizing our path to the program.
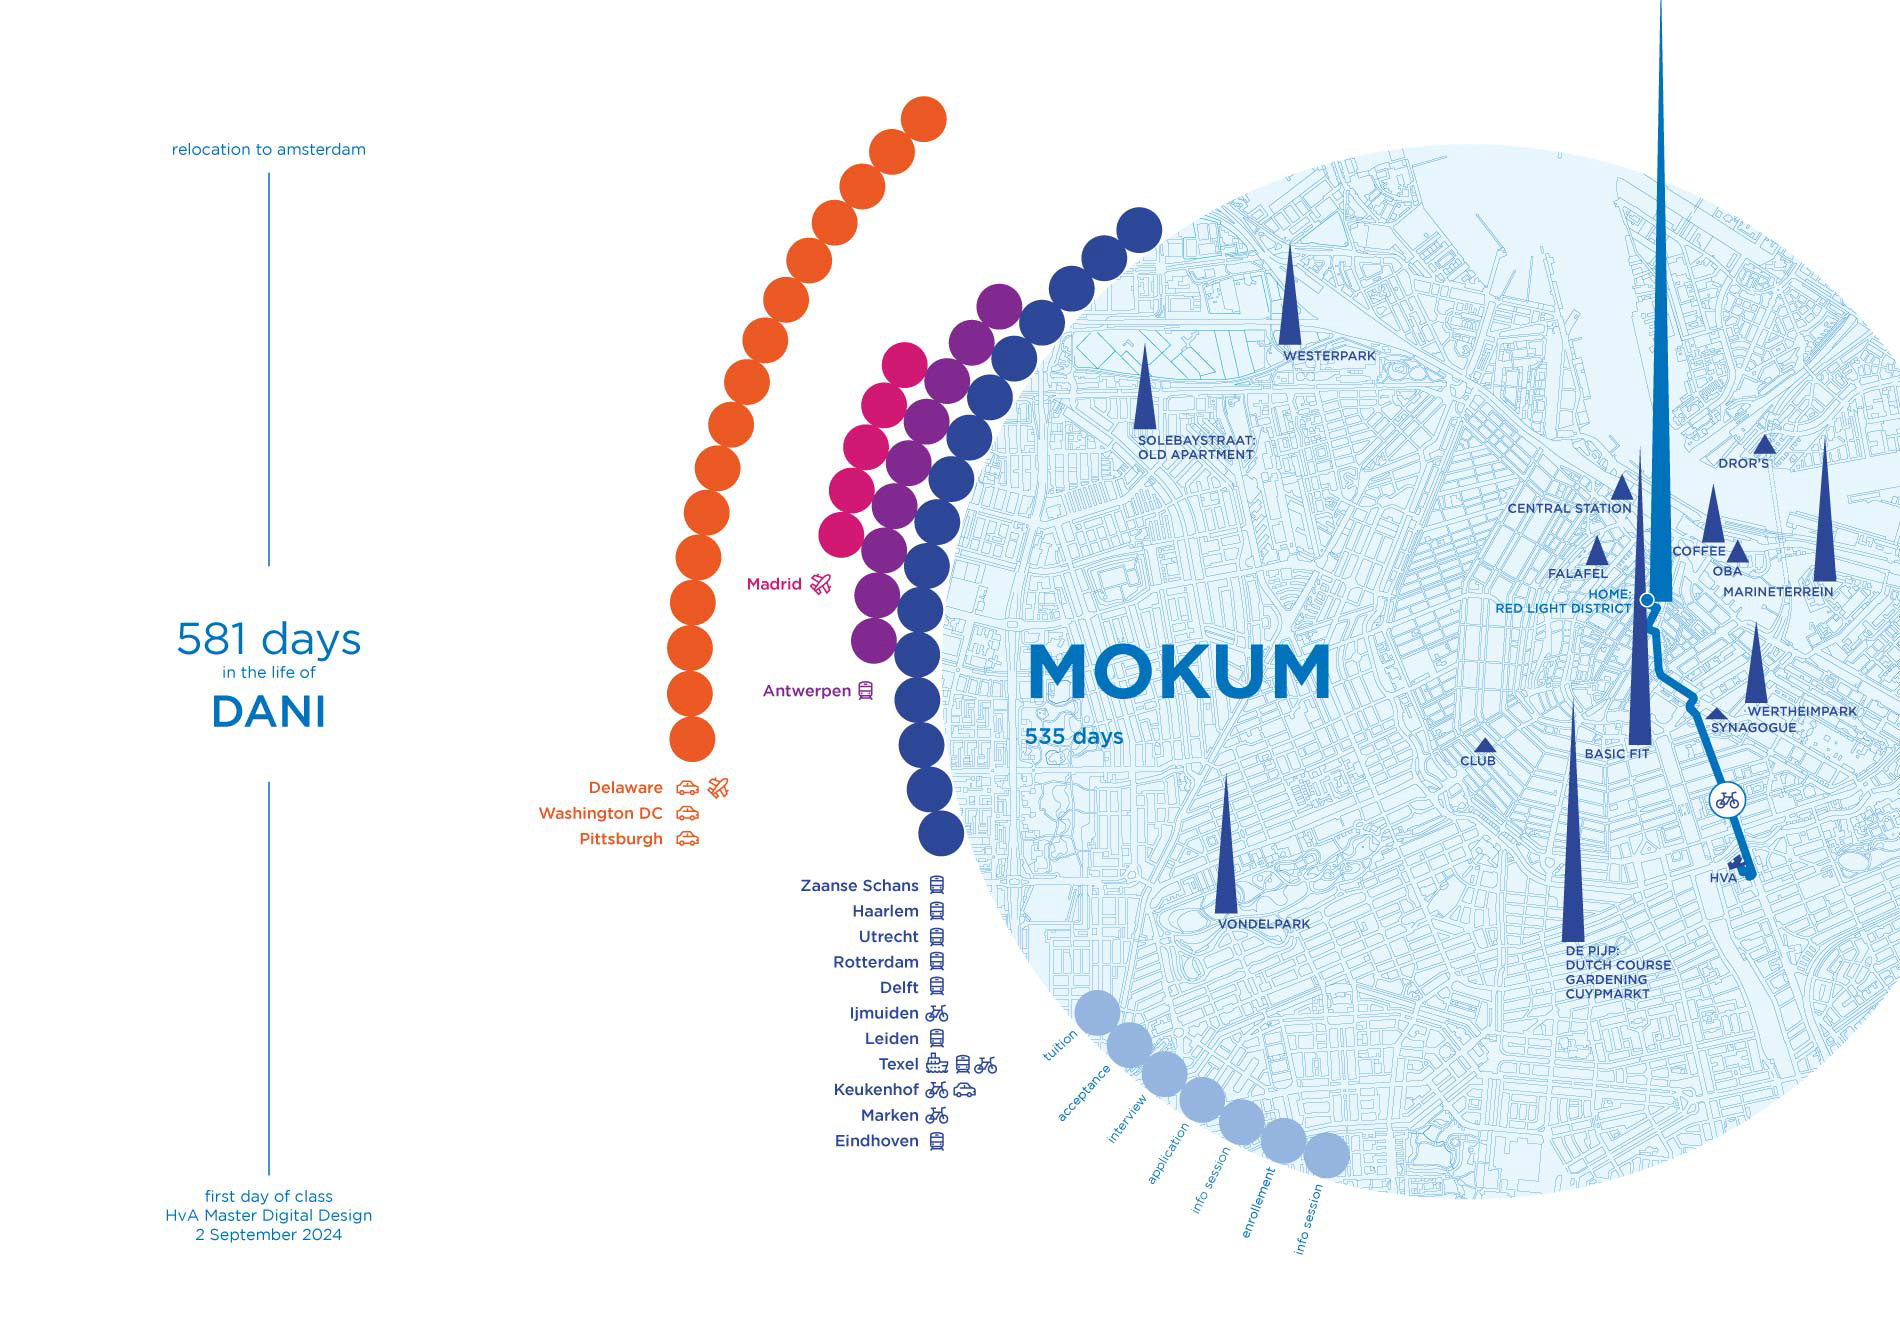
As the first assignment for the Master of Digital Design at Hogeschool van Amsterdam, we were given three days to create a poster visualizing our path to the program.
I chose to represent my move from the US to Amsterdam, centering my experience of place and time in the lead-up to the program. The visualization quantifies each city and place I visited during that period, scaled by duration and positioned in relation to Amsterdam.
With a nod to infographic designer Nicholas Felton, the poster expresses both spatial and emotional proximity—showing how MOKUM (Amsterdam) became my new center of gravity.